An agent-native pipeline built for autonomous incident resolution
Seven specialized agents. Detection to resolution. Governed at every step.
From the moment a signal is detected, specialized agents classify it, enrich it with live context, score its risk, select the right remediation — and execute it without waiting for a ticket to be picked up. Sign-off happens exactly where policy demands it, and nowhere else.
Designed and created by AI.
Key advantages
Built agent-native. Not AI bolted onto legacy ticketing.
Most "AI-powered" ITSM tools are decades-old ticketing systems with a chatbot added on top. Axiometica AIR was built the opposite way — agents are the primary worker. Each incident moves through a governed pipeline that classifies, enriches, scores risk, selects the right remediation, and executes it — automatically where policy allows, with your team's sign-off where it doesn't.
Agent-native, not AI bolted on
Most "AI-powered" ITSM tools are decades-old ticketing systems with a chatbot added on top. Axiometica AIR was built the opposite way — agents are the primary worker from the ground up. Incidents are worked the moment they're detected, not when a human picks up the ticket.
Governed autonomy — trust earned, not assumed
Every automated action passes through a policy gate. You decide what runs autonomously and what requires sign-off — by environment, by service, by risk score, by blast radius. Runbooks earn the right to run unattended through a proven track record, the same way you'd extend trust to a new team member: gradually, and on the evidence.
Self-improving platform intelligence
The platform watches its own outcomes. Platform Intelligence continuously analyzes resolved incidents to surface concrete tuning recommendations: which alert types are mostly noise, which runbooks are underperforming, where automation coverage is thin. Recommendations are reviewed before anything changes — visibility and control together, getting measurably sharper over time.
Works with your existing stack
Axiometica AIR sits on top of your existing monitoring stack — Datadog, Splunk, Prometheus, PagerDuty, Zabbix and others connect via webhook. Every alert they generate gets qualified, enriched, and routed through the autonomous pipeline. Your existing investment stays in place; it simply gains a resolution capability it never had.
LLM-agnostic — including your own models
The reasoning layer is built behind a provider-agnostic architecture — the underlying AI model is a configuration choice, not something wired into the product. Use a hosted model or bring your own internally-hosted one. Sensitive operational data stays inside your perimeter, inference costs stay under your control.
Storm detection — one incident, not one hundred
When a single root cause fires alerts across multiple resources at once, Axiometica AIR recognizes the correlation and groups everything under one parent incident. Your team coordinates a single outage, not a flood of duplicate tickets — and related incidents are held until the root issue is addressed.
Full audit trail, built for compliance
Every decision, every action, every approval, every outcome is logged — automatically, not as an afterthought. Fail-closed defaults mean the system never silently auto-approves on ambiguity; when it can't be confident, it asks. That's the posture compliance and audit teams actually want from automation touching production infrastructure.
A live CMDB that reflects reality
Most configuration databases describe what's supposed to be running — maintained manually and chronically out of date. Axiometica AIR maintains a live resource graph that agents both read from and write back to as incidents resolve, and can sync bidirectionally with ServiceNow if that's your system of record for compliance.
Explainable risk scoring, not a black box
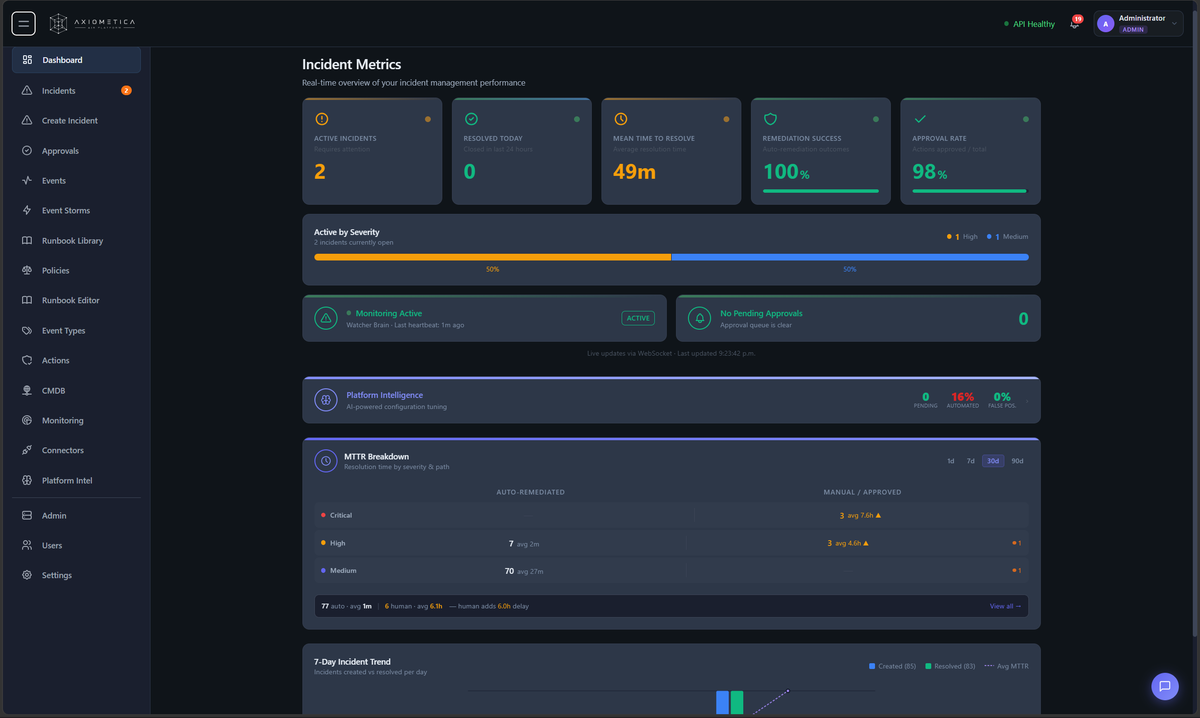
Every incident's risk score is built from a transparent, weighted breakdown — severity, business criticality, blast radius, SLA exposure, dependency count, and more. Your team can see exactly why an incident was prioritized the way it was, and tune the weighting to your own business priorities.
Platform in action
Platform Features
The engine evaluates incident context, selects the matching runbook, and shows confidence percentage and blast radius before executing a single action. Every step is logged.
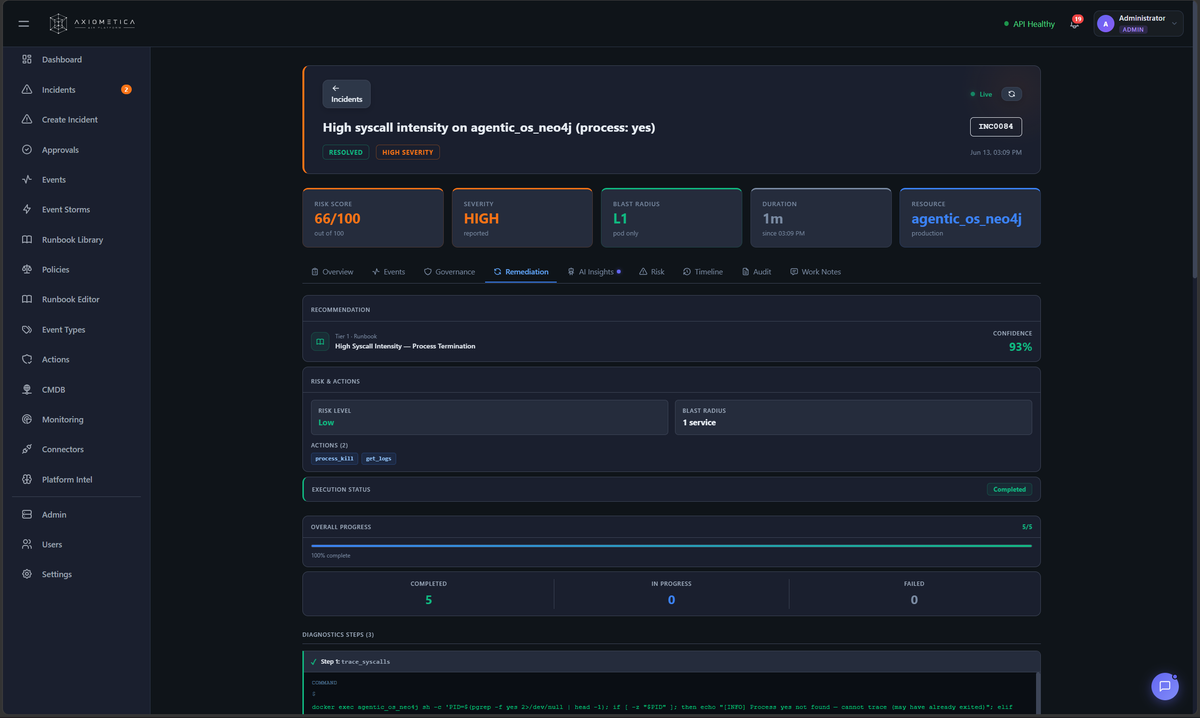
K8s Scale-Out · 3 steps · confidence: 78%
Integrations
Works with your existing stack
Connect ServiceNow for CMDB sync and incident push-back. Receive alerts from Splunk, PagerDuty, Dynatrace, Prometheus, or Zabbix. New connectors configurable via the UI — no code required.
View connector docs →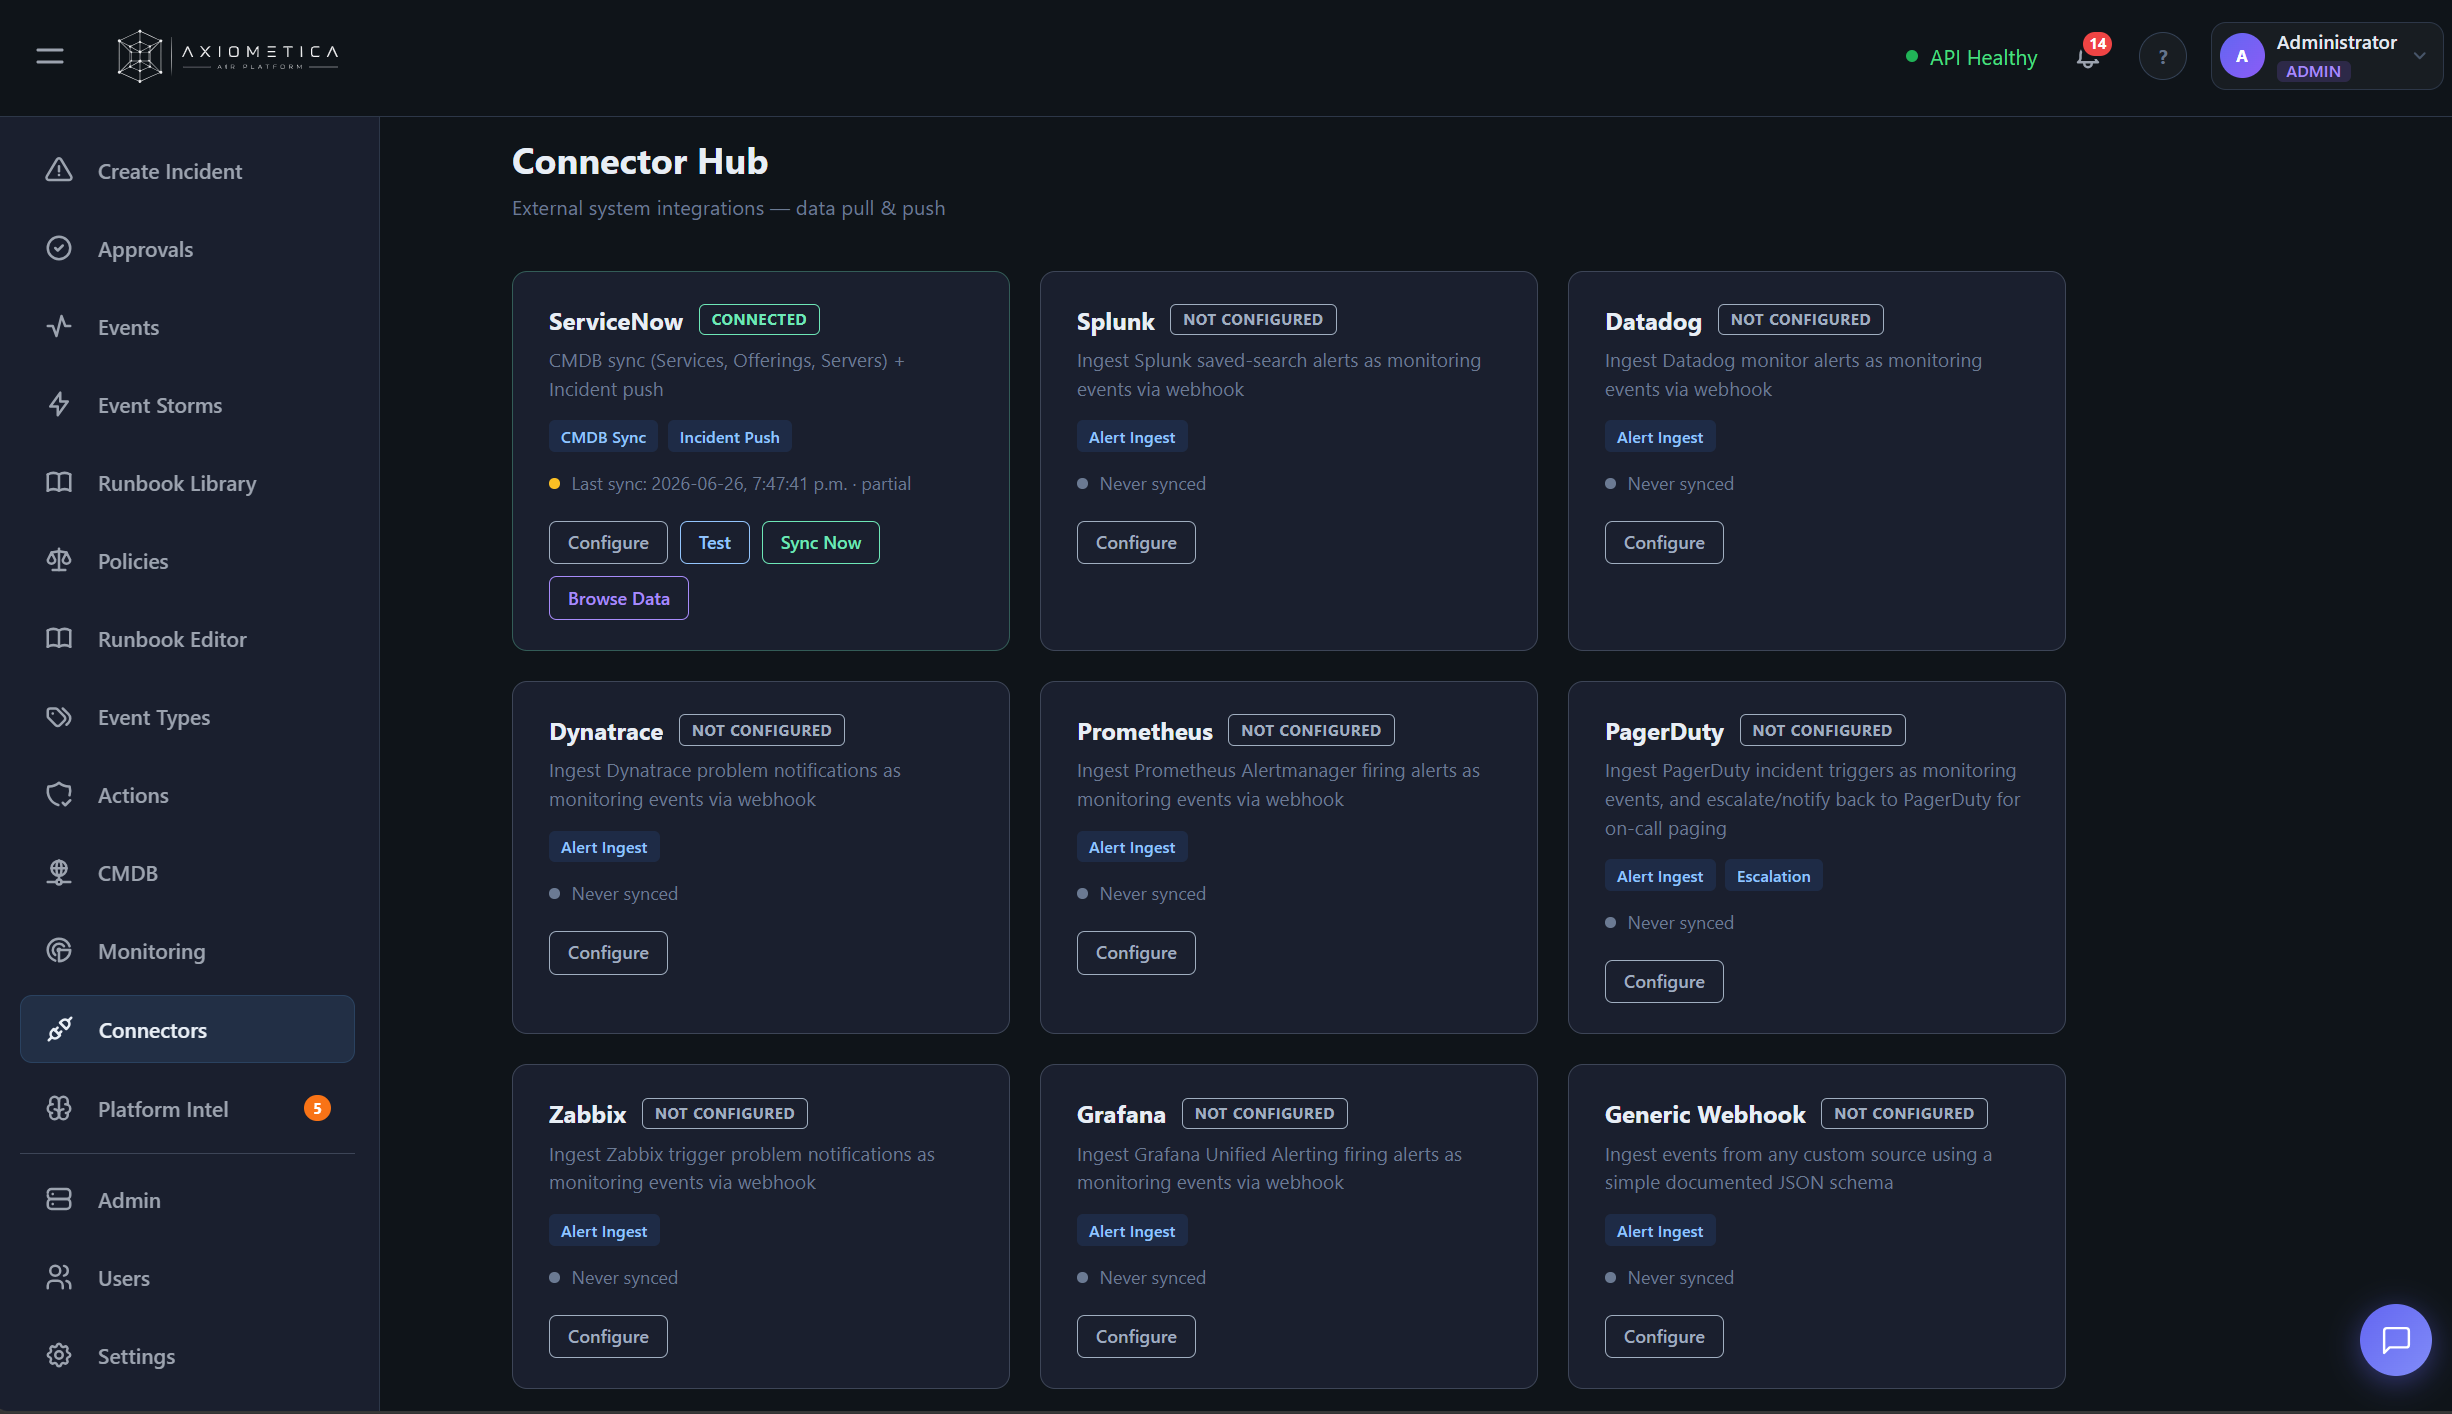
Enterprise credentials
Runs in your environment
Fully containerized — deploy to your own cloud account, your data center, or fully on-premises. Operational data never leaves your perimeter.
Enterprise-grade governance
RBAC, configurable approval gates, fail-closed defaults, and a full audit trail on every decision, action, and outcome — built for compliance-conscious environments.
Production-scale, no rip-and-replace
Horizontally scalable and containerized. Sits on top of your existing monitoring stack via webhooks — your current investment stays, it gains a resolution capability it never had.
Secure by architecture
AES-256 at rest, TLS 1.2/1.3 in transit, HMAC-validated webhooks, secrets masked at every layer. RBAC, SSO/SAML/OAuth2, MFA. Outbound-only network posture — no inbound ports, no vendor callbacks, per-connector credential isolation.
Open core
Free forever. Enterprise when you're ready.
The full platform is open source under Apache 2.0 — self-hosted, no feature gates, no usage limits. The Enterprise license adds commercial-use rights and support terms for organisations that need them.
Apache 2.0 · Self-hosted · Free for non-commercial use and organisations with fewer than 25 employees
- Full platform — no feature gates
- Visual runbook editor
- Agentic decision engine
- CMDB graph + event taxonomy
- Event storm correlation
- All execution adapters (SSH, K8s, AWS, Azure, vCenter)
- Community GitHub support
90-day free evaluation · Commercial-use license · Ontario/Canada governing law · Liability cap included
- Everything in Community
- Commercial-use license
- Up to 90-day free evaluation period
- Priority support with defined response expectations
- Custom deployment assistance
- Liability-capped agreement (Ontario/Canada governing law)
From alert to resolution, autonomously.
Self-host in 10 minutes with Docker Compose. Your infrastructure, your data, no vendor lock-in.